WRITE
One thing per note
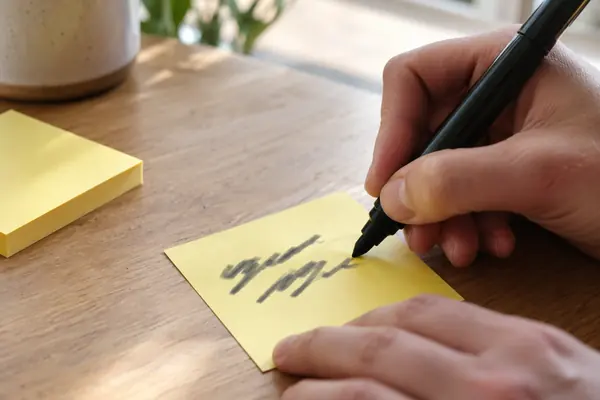
GOV.UK guidance says to write exactly what you saw or heard, one observation per note, not what you think it means. Analysis comes later.
Check a noteHOW TEAMS SORT IDEAS
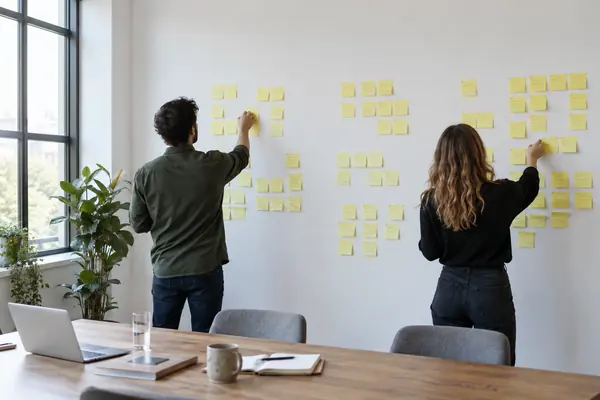
A wall of sticky notes is a thinking tool.
UK government user researchers call the sticky note their unit of data. Write one observation per note, sort them together until clusters appear, and the themes, findings and next steps follow.

ONE NOTE one thought
THE SHORT ANSWER
The method is usually called affinity diagramming.
It works for research notes and brainstorms alike.
WRITE
GOV.UK guidance says to write exactly what you saw or heard, one observation per note, not what you think it means. Analysis comes later.
Check a noteSORT
Put every note on a wall and move them, including other people's, until clear groups form. Then agree a name for each group.
The stepsDECIDE
Government researchers write observations on one colour, findings on a second and actions on a third, so the wall reads as a plan.
See the numbersA QUICK NOTE CHECK
Pick a kind of note to see how it fits the guidance from GOV.UK's user research team. The bar shows how well it follows that advice.
Based on the GOV.UK Service Manual and the GOV.UK user research blog. These are working habits, not hard rules.
TWO NUMBERS WORTH KNOWING
One figure on how long analysis takes,
one on how long to spend writing notes.
1 hour
Analysis for every 2 hours of research
The GOV.UK Service Manual advises spending 1 hour analysing for every 2 hours of research, as soon as possible after each round while it is fresh.
ANALYSIS TIME · GOV.UK
5–10 min
Time to write ideas on notes
Nielsen Norman Group suggests giving people a set time, typically 5 to 10 minutes, to write their notes so they do not overanalyse.
WRITING TIME · NN/G
At scale: for one discovery, GDS researchers interviewed 150 services and analysed the results in 4 sessions of 3 hours, with 12 colleagues in each.
FOUR STEPS ON ONE WALL
This is the affinity mapping sequence described by GOV.UK and Nielsen Norman Group. It works on a wall or a digital whiteboard.
Each person writes their own notes before discussing, so louder voices do not steer the ideas. Use one colour.
Put every note up and group similar ones. Anyone can move anyone's note; keep going until clear groups emerge.
Agree a title for each cluster. One GDS team labelled clusters with statements, not nouns, and aimed for 6 to 10 findings.
Write findings on a second colour and actions on a third, then prioritise so you leave with next steps.

WHY PAPER STILL WINS
GOV.UK's user research team wrote that sticky notes give a fast yet thoughtful and collaborative way to analyse, in a way no digital tool they had found allowed. Nielsen Norman Group notes that virtual sticky notes on digital whiteboards follow the same steps.
The practical tips are simple: write in capital letters so everyone can read it, match a thick pen to the note, never use a biro, and buy decent notes, because cheap glue means notes raining off the wall mid-session.
Questions
Organising related observations, ideas or findings into clusters, usually with physical or virtual sticky notes. It is also called affinity diagramming, affinity sorting, collaborative sorting or snowballing.
No. Nielsen Norman Group says affinity diagramming groups broad ideas, while card sorting is a specific research method for working out the information architecture of a website or app.
GOV.UK guidance has observers capture every observation on one colour, then uses a second colour for findings and a third for actions, so the stages stay visible on the wall.
Nielsen Norman Group says the writing step is usually done independently, to avoid team members being biased by each other or by dominant personalities.
Nielsen Norman Group suggests duplicating it and putting it in both clusters, and not forcing ideas into a set number of groups.
Sources
ABOUT THIS NAME
doodlestickynotes.com is part of the DoodleSale portfolio. It isn't in an auction right now, but you can ask about leasing it.